How to set up Nagios Remote Plugin Executor
Nagios is a system for remotely monitoring servers. It comes in two parts -- Nagios Core, covered here which provides a front-end and database for server logging information, and NPRE, covered in this page, which is a collection of agents which gather information from servers, and feed them back to Core.
We have a Nagios Core installed on bc-monitor and if you need access to it, please ask the CTO for the user name and password.
Each of our servers runs a Nagios Remote Plugin Executor (NRPE) server.
Nagios (on bc-monitor) sends requests to the NRPE servers to ask for information about each server (e.g. load, disk space, etc.).
When setting up a new server, the NRPE server and its plugins need to be installed, and a new entry for the server needs to be added to the Nagios configuration in bc-monitor.
Installing NRPE and its plugins
On Ubuntu 14.04:
The nrpe server that is installed via apt-get is out of date (major version 2, we need major version 3).
This article describes in detail how to install NRPE from source.
Remember, you need to install both the NRPE server and its plugins.
On Ubuntu 18.04:
sudo apt-get install nagios-nrpe-server
Configuring NRPE
Open the file /ect/nagios/nrpe.cfg in your favourite text editor (or, on Ubuntu 14.04 where we have had to install NRPE from source, this file is /usr/local/nagios/etc/nrpe.cfg).
Look for a line that starts allowed_hosts=, and set this to:
allowed_hosts=127.0.0.1,::1,10.210.127.55
The last IP address is the address of bc-monitor on the local network.
Next look for a block of example plugin commands with hard-coded arguments. This should something like the following:
command[check_users]=.../nagios/plugins/check_users -w 5 -c 10
command[check_load]=.../nagios/plugins/check_load -r -w 0.7,0.6,0.5 -c 0.9,0.8,0.7
command[check_disk]=.../nagios/plugins/check_disk -w 20% -c 10% /dev/sda1 -I /var/lib/docker/* -I /run/docker/*
command[check_zombie_procs]=.../nagios/plugins/check_procs -w 5 -c 10 -s Z
command[check_procs]=.../nagios/plugins/check_procs -w 250 -c 300
Note, you will need to change the names of check_disk and check_procs -- these must be correct, otherwise Nagios will not be able to run the correct remote plugin.
Also, note that check_disk names the device it checks -- /dev/sda1 in this example.
This should be the device mounted on /, and you should run mount to find the path to that device:
$ mount
sysfs on /sys type sysfs (rw,nosuid,nodev,noexec,relatime)
proc on /proc type proc (rw,nosuid,nodev,noexec,relatime)
udev on /dev type devtmpfs (rw,nosuid,relatime,size=3020656k,nr_inodes=755164,mode=755)
devpts on /dev/pts type devpts (rw,nosuid,noexec,relatime,gid=5,mode=620,ptmxmode=000)
tmpfs on /run type tmpfs (rw,nosuid,noexec,relatime,size=610448k,mode=755)
/dev/sda1 on / type ext4 (rw,relatime,errors=remount-ro,data=ordered)
securityfs on /sys/kernel/security type securityfs (rw,nosuid,nodev,noexec,relatime)
tmpfs on /dev/shm type tmpfs (rw,nosuid,nodev)
...
$
Dealing with Docker services
If the server is likely to run Docker services, some files will not be readable by NRPE, so they need to be excluded from the command line, e.g.:
command[check_disk]=.../nagios/check_disk -w 20% -c 10% /dev/sda1 -I /var/lib/docker/* -I /run/docker/*
The -I switch means ignore these specific paths or disks.
We have also changed the arguments to check_load and check_procs -- this page explains how to derive sensible values for check_load.
You can check that this works, by running one of the plugins by hand:
$ .../nagios/plugins/check_procs -w 250 -c 300
PROCS OK: 123 processes | procs=123;250;300;0;
check_apt
Uncomment the line that checks the relevant package manager (apt on Ubuntu machines), such as:
command[check_apt]=.../nagios/plugins/check_apt
check_swap
Uncomment the line that checks for available swap space, and configure it like this:
command[check_swap]=.../nagios/plugins/check_swap -w 25%% -c 15%%
Security
It is possible for the Nagios server to send command line arguments to NRPE agents, which obviates the need to hard-code the arguments into each NRPE server configuration.
However, this is a security risk (as it allows the Nagios server to execute arbitrary Bash commands), so we always use the hard-coded versions of command.
All nrpe.cfg files should contain this line:
dont_blame_nrpe=0
Which rejects any the Nagios server requests which contain command-line arguments to NRPE agents.
Check that your config is up to date
The services that we monitor with Nagios will change from time to time.
Before you connect the new server to the Nagios front-end, compare your nrpe.cfg with the one on dev.beautifulcanoe.com to check that it configures all of the plugins we wish to run.
(Re)starting NRPE
On Ubuntu 14.04:
sudo service nrpe start
On Ubuntu 18.04:
sudo service nagios-nrpe-server start
# Enable NRPE on start-up
sudo systemctl enable nagios-nrpe-server.service
Open up port 5666 on the firewall
If your server firewall is not configured to keep port 5666 open, Nagios will show all information from the server as null.
On Ubuntu 18.04:
sudo ufw allow from any to any port 5666 proto tcp
Go through the instructions on the screen making sure to leave ports 80 and 443 open.
Adding a new server to Nagios on bc-monitor
Once the new server is running NRPE, Nagios needs to know about the server and which plugins to ask it to execute.
In /etc/nagios3/conf.d add a new file for the server, named after its hostname, e.g. actss.cfg.
In the file, add a basic configuration with just a name, alias and address:
define host {
        use                     generic-host
        host_name               actss.aston.ac.uk
        alias                   actss
        address                 134.151.45.89
}
Next, edit the file /etc/nagios3/conf.d/hostgroups_nagios2.cfg and add the server to any groups it ought to be a member of.
For example, there should be a group for each operating system we use (Ubuntu), each web server (Apache and Tomcat), and so on.
This will determine which NRPE checks are performed on the new host.
Once you have added the new host to the Nagios configuration, restart the server:
sudo service nagios3 restart
Adding a new monitoring service
NRPE comes with a number of default plugins, which can be found in their GitHub repository (note, we are using version 3.2.1 of this distribution). Third-party plugins are also available, but installing them on each server is the responsibility of the administrator.
Adding a new service to the monitoring system needs to be done in two parts:
- Each NRPE server (including
bc-monitor) needs to be configured to run the new service. - The Nagios Core server on
bc-monitorneeds to be configured to request information from the NRPE agents.
As an example, we'll consider adding a check for the Apt package manager, which is only available on Ubuntu servers.
Configuring the NRPE servers
First, log into each (Ubuntu) NRPE server and edit the nrpe.cfg file.
Add a line such as:
command[check_apt]=.../nagios/plugins/check_apt
and check on the command line that the plugin works:
$ /usr/lib/nagios/plugins/check_apt
APT OK: 0 packages available for upgrade (0 critical updates). |available_upgrades=0;;;0 critical_updates=0;;;0
Configuring the Nagios Core server
On bc-monitor we need to define a hostgroup for Ubuntu servers.
Doing this means that instead of adding the new service to each host configuration individually, we can add it to the hostgroup only once.
Edit the file /etc/nagios3/conf.d/hostgroups_nagios2.cfg, and add the following:
# A list of BC Ubuntu Linux servers
define hostgroup {
        hostgroup_name  ubuntu-servers
        alias           Ubuntu Linux Servers
        members         localhost, ...
}
Next add the following to /etc/nagios/conf.d/services.cfg:
# Define services to check package managers on the local machine
define service{
    hostgroup_name                  ubuntu-servers
    service_description             apt-get Package Manager
    check_command                   check_nrpe!check_apt
    use                             generic-service
}
And restart the server:
sudo service nagios3 restart
The Services page on the Nagios website should now show the new package manager checks.
Troubleshooting
Nagios on bc-monitor writes to a log which you can follow:
sudo tail -f /var/log/nagios3/nagios.log
More on configuring Nagios
Adding alerts
To get email alerts, you first have to be a member of a group.
A new member can be added to the /etc/nagios3/conf.d/contacts_nagios2.cfg.
This is done using define contact and then the object properties are set inside the braces.
define contact {
        contact_name                    root
        alias                           Root
        service_notification_period     24x7
        host_notification_period        24x7
        service_notification_options    w,u,c,r
        host_notification_options       d,r
        service_notification_commands   notify-service-by-email
        host_notification_commands      notify-host-by-email
        email                           NAME@DOMAIN.com
}
You then have to define a group in the same file (/etc/nagios3/conf.d/contacts_nagios2.cfg) and add members to that group:
define contactgroup {
        contactgroup_name       admins
        alias                   Nagios Administrators
        members                 root
}
After, you can navigate to the services and set the contact_groups property in the chosen service scope to the name you've added to the contact group.
Those who are apart of the group will then be emailed alerts.
Service fields
These fields are compulsory and have to be apart of all service definitions:
| Field | Use |
|---|---|
| host_name | specify the short name(s) of the host(s) that the service "runs" on or is associated with. Multiple hosts should be separated by commas. |
| service_description | define the description of the service, which may contain spaces, dashes, and colons (semicolons, apostrophes, and quotation marks should be avoided). No two services associated with the same host can have the same description. Services are uniquely identified with their host_name and service_description directives. |
| max_check_attempts | define the number of times that Nagios will retry the service check command if it returns any state other than an OK state. Setting this value to 1 will cause Nagios to generate an alert without retrying the service check again. |
| check_interval | define the number of "time units" to wait before scheduling the next "regular" check of the service. "Regular" checks are those that occur when the service is in an OK state or when the service is in a non-OK state, but has already been rechecked |
| retry_interval | define the number of "time units" to wait before scheduling a re-check of the service. Services are rescheduled at the retry interval when they have changed to a non-OK state. Once the service has been retried max_check_attempts times without a change in its status, it will revert to being scheduled at its "normal" rate as defined by the check_interval value. Unless you've changed the interval_length directive from the default value of 60, this number will mean minutes. More information on this value can be found in the check scheduling documentation. |
| check_period | specify the short name of the time period during which active checks of this service can be made. |
| notification_interval | define the number of "time units" to wait before re-notifying a contact that this service is still in a non-OK state. Unless you've changed the interval_length directive from the default value of 60, this number will mean minutes. If you set this value to 0, Nagios will not re-notify contacts about problems for this service - only one problem notification will be sent out. |
| notification_period | specify the short name of the time period servicesduring which notifications of events for this service can be sent out to contacts. No service notifications will be sent out during times which is not covered by the time period. |
| contacts | This is a list of the short names of the contacts that should be notified whenever there are problems (or recoveries) with this service. Multiple contacts should be separated by commas. Useful if you want notifications to go to just a few people and don't want to configure contact groups. You must specify at least one contact or contact group in each service definition. |
| contact_groups | This is a list of the short names of the contact groups that should be notified whenever there are problems (or recoveries) with this service. Multiple contact groups should be separated by commas. You must specify at least one contact or contact group in each service definition. |
Contact fields
These fields are compulsory and have to be apart of all service definitions:
| Field | Use |
|---|---|
| contact_name | define a short name used to identify the contact. It is referenced in contact group definitions. Under the right circumstances, the $CONTACTNAME$ macro will contain this value. |
| host_notifications_enabled | determine whether or not the contact will receive notifications about host problems and recoveries. Values: 0 = don't send notifications, 1 = send notifications. |
| service_notifications_enabled | determine whether or not the contact will receive notifications about host Definition problems and recoveries. Values: 0 = don't send notifications, 1 = send notifications. |
| host_notification_period | specify the short name of the time period during which the contact can be notified about host problems or recoveries. You can think of this as an "on call" time for host notifications for the contact. Read the documentation on time periods for more information on how this works and potential problems that may result from improper use. |
| service_notification_period | specify the short name of the time period during which the contact can be notified about service problems or recoveries. You can think of this as an "on call" time for service notifications for the contact. Read the documentation on time periods for more information on how this works and potential problems that may result from improper use. |
| host_notification_options | define the host states for which notifications can be sent out to this contact. Valid options are a combination of one or more of the following: d = notify on DOWN host statThere's also fields that are not compulsory but can be useful and they can be found here.es, u = notify on UNREACHABLE host states, r = notify on host recoveries (UP stahis directtes), f = notify when the host starts and stops flapping, and s = send notifications when host or service scheduled downtime starts and ends. If you specify n (none) as an option, the contact will not receive any type of host notifications. |
| host_notification_commands | define a list of the short names of the commands used to notify the contact of a host problem or recovery. Multiple notification commands should be separated by commas. All notification commands are executed when the contact needs to be notified. The maximum amount of time that a notification command can run is controlled by the notification_timeout option. |
| service_notification_commands | define a list of the short names of the commands used to notify the contact of a service problem or recovery. Multiple notification commands should be separated by commas. All notification commands are executed when the contact needs to be notified. The maximum amount of time that a notification command can run is controlled by the notification_timeout option. |
Optional fields
There are also fields that are not compulsory but can be useful. These can be found here.
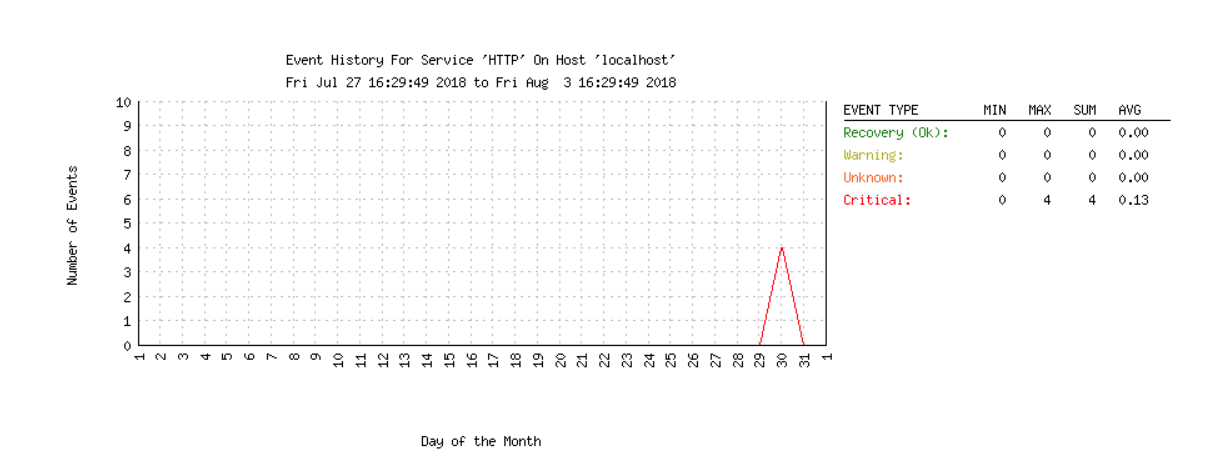
Generating histograms
Histograms will give you a visual representation of the state of a service over a period of time, which can be useful in diagnosing defects.
To create a histogram, first go to the histogram creation page:
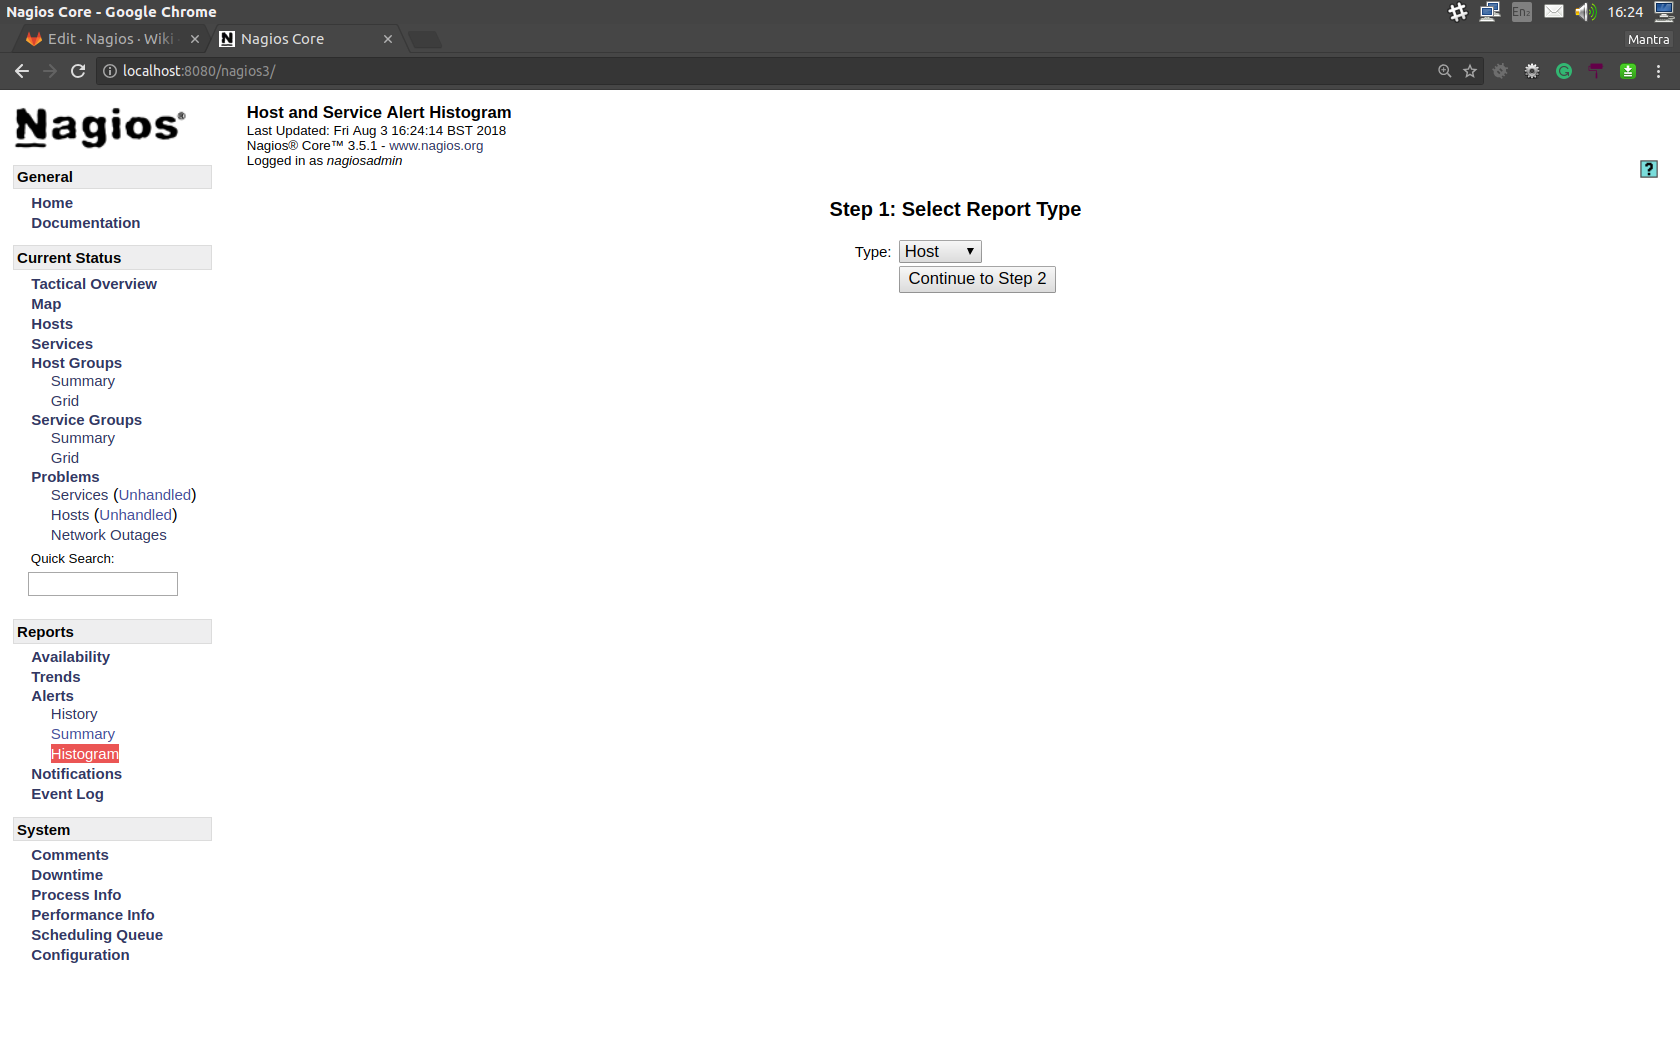
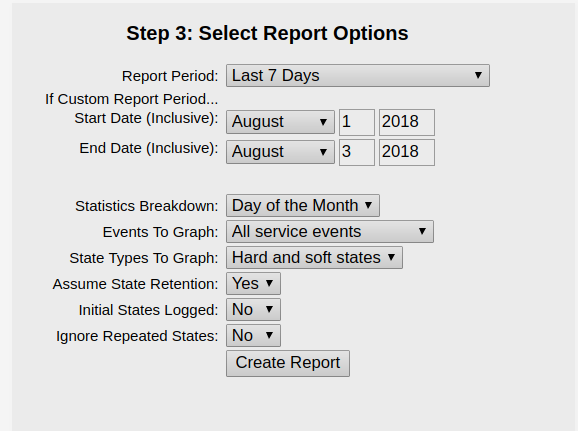
Select whether you want generate a histogram for a host or service. Then configure the options so that they satisfy your requirements:
After you finish configuring, the graph should be generated: