How to debug PHP applications
This guide covers three ways to debug PHP applications:
- Debugging from within Homestead
- Debugging by viewing a PHP object in Chrome
- Debugging on a local machine (i.e. not in Homestead)
Debugging in Homestead
Following instructions explain how to install, setup and configure Xdebug in Homestead box and work with PhpStorm IDE. This page contains a more comprehensive set of instructions.
Installing Xdebug
Install the Xdebug on Homestead by first logging in as super user.
sudo apt-get install php-xdebug
Open /etc/php/your_php_version/fpm/conf.d/20-xdebug.ini in a text editor and configure xdebug.ini with the following settings:
zend_extension = xdebug.so
xdebug.remote_enable = 1
xdebug.remote_connect_back = 1
xdebug.remote_port = 9000
xdebug.max_nesting_level = 512
Do the same with /etc/php/your_php_version/cli/conf.d/20-xdebug.ini.
If it does not exist, enable the xdebug module with:
sudo phpenmod xdebug
To confirm that Xdebug was set up correctly, run:
php -m
to list all your installed PHP modules, and look for Xdebug.
Configuring PHPStorm
In PHPStorm, navigate to Settings->PHP->Servers (Settings may be called Preferences in MacOS) and find your project files.
In the Absolute path on the server, enter the path where your project is saved in your Homestead environment.
For instance, /home/vagrant/Projects/my-project.
Add the Xdebug extension to your browser and enable it. Xdebug Helper for Firefox or Xdebug helper for Chrome are both free.
You should also make sure that PHPStorm is connected to PHPUnit by selecting Run > Start Listening for PHP Debug Connections.
Now you are set up, you can set a breakpoint in the PHP script and refresh the page in the browser you want to debug.
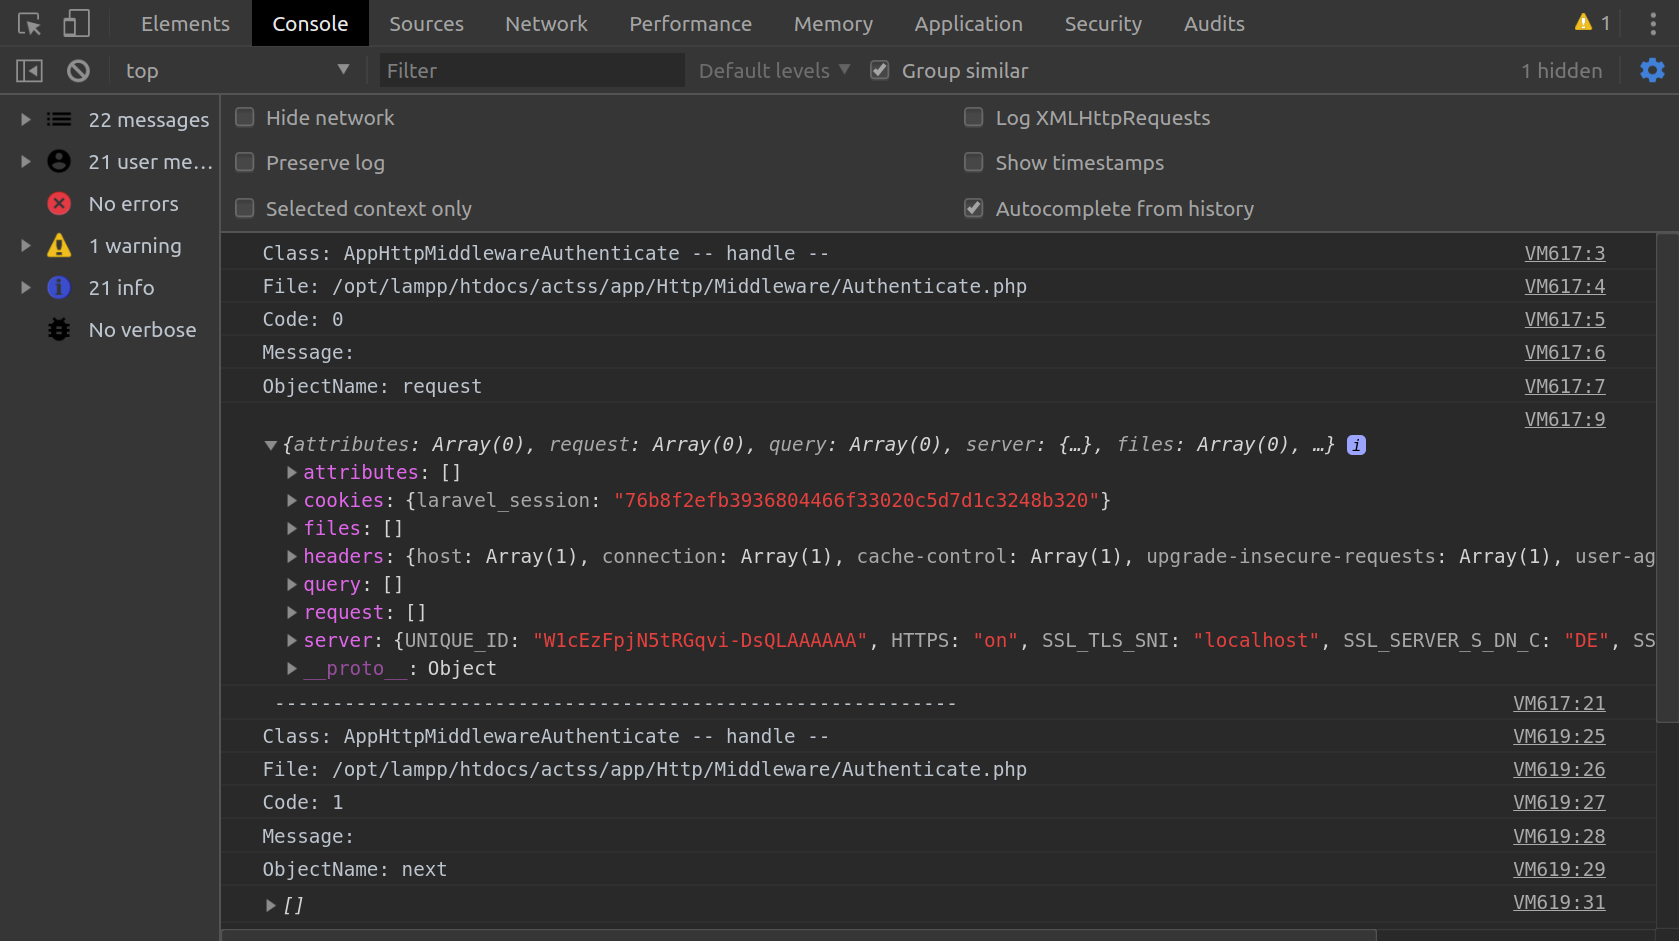
Viewing PHP objects in Chrome / Firefox
To view a live PHP object from your browser:
- Download Debugging.php and add the class to your project.
- Call the
phpObjectToChrome()function and pass in the appropriate arguments (see below). - Open the dev tool in the browser (Ctrl+Shift+I in Chrome) and the PHP object should be there.
Example
Debugging::phpObjectToChrome($request, '$request');
Arguments to phpObjectToChrome()
$object: This is the object that will be sent to the browser console and is passed via the function parameters.- String -
$objectName: This is a string that will be used as a label for the object in the console. - global static array:
$fullTraces: this is a static array that will store all the values of alldebug_backtracefor all the calls that are made to thePhpObjectToChromefunction.
Procedure
- Store the backtrace in
$fullTraces - Convert the PHP object (
$object) to an array using the PHPobjectToArray()function. - Convert the arrays to JSON objects so that they can be used in the Javascript. Javascript cannot understand PHP objects, however, it works well with JSON objects so the PHP objects have to be converted.
- Use the
getShortInfo()function to check for and get values from the backtrace. Return array with the different values. After this information is returned, extract certain elements such as class and store them in individual variables, for example, the class would be stored in the$shortCallInfoClass. I did this because Javascript does not let me echo data by specifying its position in the PHP array but it does let me echo a single variable.
Output
- Echo will be used to create Javascript scripts that return the values gathered by this function.
- Use
console.log()to return the short information for this call. This includes values such as the class name, file name etc. - Also,
console.log()the JSON version of the$object. Javascript automatically converts JSON objects to array so there's no need to parse the$objectJson. - Convert the current array of
jsonFullTracesinto a Javascript array in case the user requests them. - echo a Javascript function that returns the full backtrace for a function. The user will call this function and give the id of the call they want to get the full trace for.
Debugging on your local machine (i.e. without Homestead)
The following sections describe how to install and configure Xdebug for a specific operating system.
Windows
- Go to this page and download the correct 32/64 bit version. Do not get the non-TS version.
- In your
php.inifile (find it where you installed PHP), under 'Module Settings', add the following:
[Xdebug]
zend_extension="path to .dll file you downloaded in step 1"
xdebug.remote_enable=1
xdebug.remote_host=localhost
xdebug.remote_port=9000
xdebug.remote_handler=dbgp
Under 'Dynamic Extensions' add ;extension=xdebug.
MacOS High Sierra
MacOS High Sierra comes with a pre-installed Xdebug, but if you try to use it, you may find that it errors. In order to make it work, the debugger needs to be compiled manually.
- Clone Xdebug using
git clone git://github.com/xdebug/xdebug.git. cd xdebug- Now run
phpizeinside the directory. - If everything went good, you should see something like this:
Configuring for:
PHP Api Version:        201603003
Zend Module Api No:     201603003
Zend Extension Api No:  320160303
- Execute
./configureandmakecommands one after the other. - To workaround traditional installation approach of xdebug.so, we will install the extension to the
usr/localfolder:
mkdir -p /usr/local/php/extensions
cp modules/xdebug.so /usr/local/php/extensions
- Lastly find the
php.inifile and addzend_extension=/usr/local/php/extensions/xdebug.so. - To test it, run
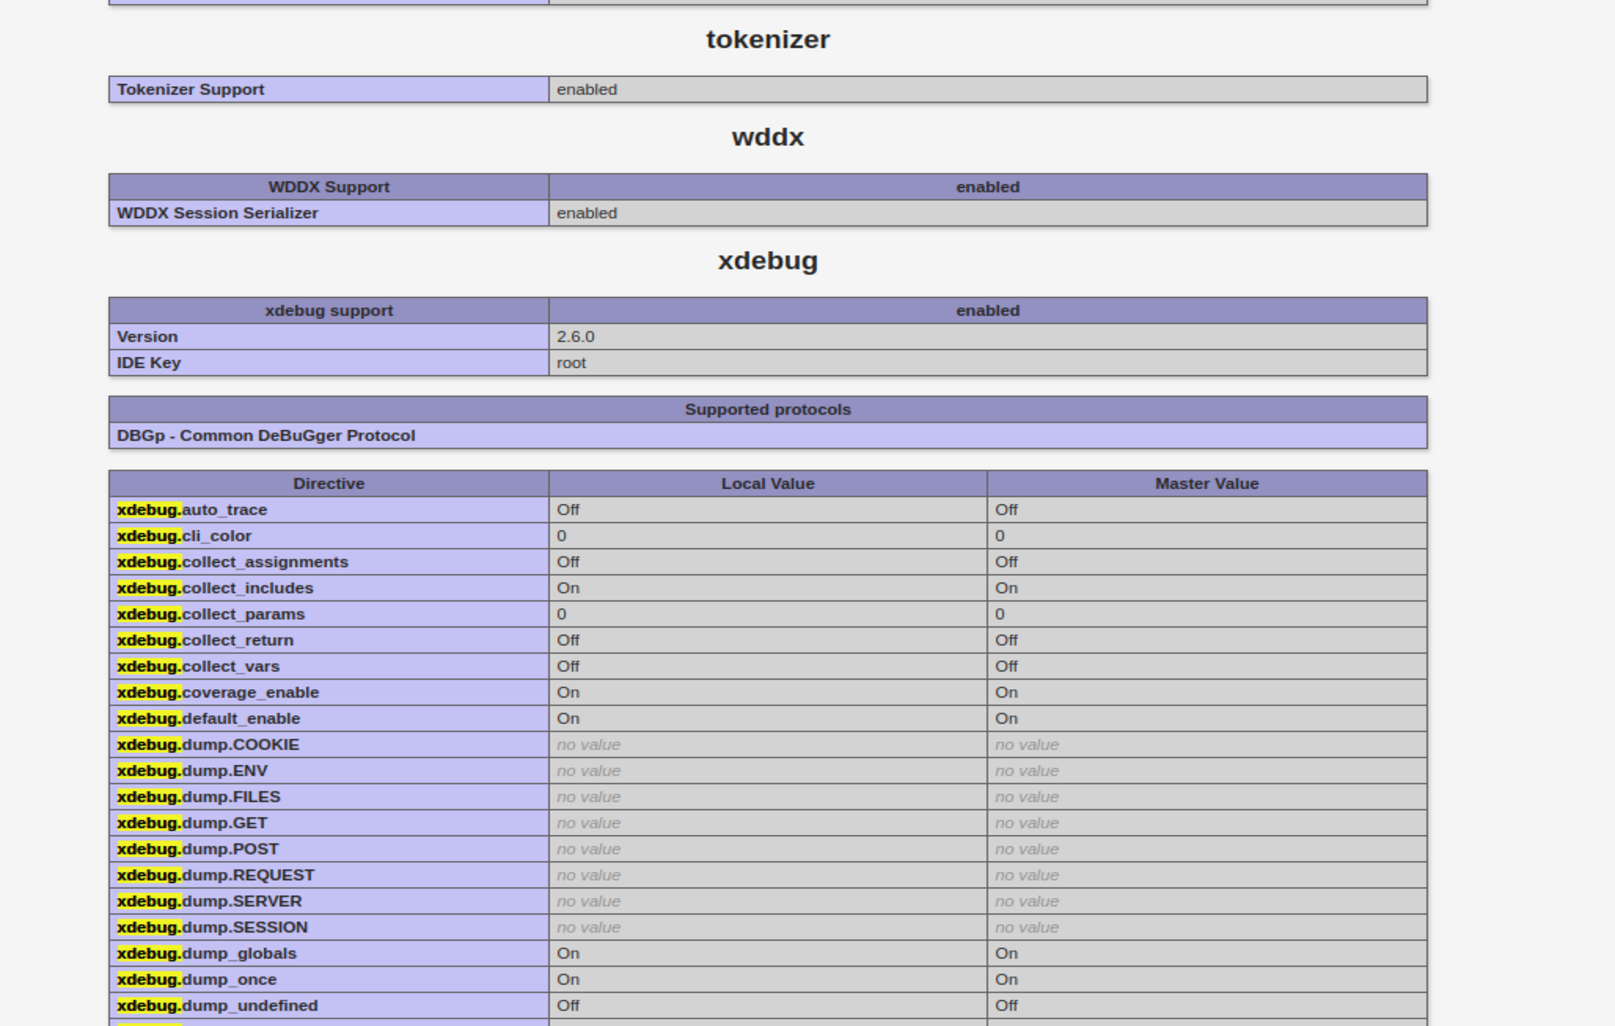
php -i | grep xdebug. The output should begin with:
xdebug
xdebug support => enabled
....
Ubuntu (16.04.4 Xenial)
- UPDATE PHP TO THE LATEST VERSION or find the right xdebug version for your php version
- https://xdebug.org/wizard.php Paste PHPINFO html here in here to get bespoke installation instructions
- Download xdebug 2.5.3 or better depending on your PHP version from the webpage. Use https://github.com/xdebug/xdebug/releases
- Cd into the extracted folder and then install the extension using the php extension installer
- phpize
- ./configure
- make && make install
- Add the xdebug.so to php.ini
[Xdebug]
zend_extension = "/opt/lampp/lib/php/extensions/no-debug-non-zts-20170718/xdebug.so"
xdebug.remote_enable = 1
xdebug.remote_autostart = 1
xdebug.remote_handler = dbgp
xdebug.remote_mode = req
xdebug.remote_host = 127.0.0.1
xdebug.remote_port = 8123
xdebug.max_nesting_level = 300`
Finally restart the server and check phpinfo and you should have an xdebug section
Debugging a Docker container
In order to do step-by-step debugging on a PHP application running inside a Docker container, you will need to follow three general steps:
- Ensure that the Docker container has the PHP
xdebugextension installed and enabled. - Ensure that your Docker Compose file uses the Docker container with that extension.
- Tell your IDE about your Docker container for debugging tests and the running webapp.
Modifying the Dockerfile
As a general rule, it is recommended to use multi-stage builds for your Dockerfiles.
They allow you to separate the steps that always need to happen (the base stage) from those that should only happen in production environments (the production stage) and in local development environments (the development stage).
First, ensure that your first FROM statement in the Dockerfile indicates that this is the base stage, and that you have an XDEBUG_VERSION argument for your build.
For example:
ARG XDEBUG_VERSION=2.9.6

FROM php:7.4-fpm-alpine3.13 AS base
Next, if you do not have a development stage yet, add it at the end of your Dockerfile with:
FROM base AS development
ARG XDEBUG_VERSION
Please note that the ARG XDEBUG_VERSION line is needed to have Docker propagate the XDEBUG_VERSION variable that was declared at the beginning of the Dockerfile to this stage.
Below this FROM line, add the commands to install the xdebug extension.
If you are using the Debian-based php image, use this:
# Install the XDebug PHP extension
RUN pecl install xdebug-${XDEBUG_VERSION} \
    && docker-php-ext-enable xdebug \
    && echo "xdebug.remote_enable=1" >> /path/to/php.ini \
    && echo "xdebug.remote_host=host.docker.internal" >> /path/to/php.ini
Important
Note that in Dockerfiles, we always concatenate lines with &&, to reduce the number of layers in the Docker image.
However, if your Dockerfile fails to build and you need to debug it, you may want to temporarily place some shell commands in separate RUN statements.
This will help you to identify which line of code is causing problems, but you will need to remove the extra RUN commands before you commit your changes.
If you are using the Alpine-based php image, you will need a bit more:
# Install the XDebug PHP extension
RUN apk --update add --no-cache $PHPIZE_DEPS \
    && pecl install xdebug-${XDEBUG_VERSION} \
    && docker-php-ext-enable xdebug \
    && echo "xdebug.remote_enable=1" >> /path/to/php.ini \
    && echo "xdebug.remote_host=host.docker.internal" >> /path/to/php.ini
This should be enough - we do not need to change the entrypoint, command or user in order to use XDebug.
Modifying your Docker Compose file
As a recommended practice, you should have a specific Docker Compose file for a development environment (e.g. docker-compose.dev.yml).
Assuming that your app is running as the app service, you will need to add a fragment like this:
services:
  app:
    build:
      context: .
      dockerfile: path/to/your/Dockerfile
      target: development
    image: project/app:development
    # Allows container to have consistent name to talk to the host (for XDebug)
    extra_hosts:
      - "host.docker.internal:host-gateway"
This will make Docker Compose build locally your app container, targeting the development stage that will have XDebug installed.
It will also allow the container to refer to the host machine running your IDE through the host.docker.internal DNS name.
Once it is built, it will be tagged locally as being the development-stage app image for your project.
XDebug for PHPUnit tests in the PhpStorm IDE
The PhpStorm IDE has built-in support for debugging PHPUnit tests running inside Docker with XDebug.
To set this up, open your project in PhpStorm as usual, and then select Run - Edit Configurations....
Create a PHPUnit configuration, selecting Defined in the configuration file.
Tick Use alternative configuration file, and select your phpunit.xml file.
In the Interpreter field, click on the ... button and follow these steps in the new CLI Interpreters window:
- Click on + and select From Docker....
- Select Docker Compose.
- If you do not have a Docker server yet, use New... to set it up. If you have installed Docker correctly, the Unix socket option should work fine - select it and click on OK to return to the CLI Interpreters window.
- In Configuration files, select the relevant Docker Compose
.yamlfiles. You should pick all necessary files: usually you will need at least the maindocker-compose.ymland yourdocker-compose.dev.ymlwith the tweaks needed for local development. - Select the appropriate service (
appfor the current example). - You should not have to set any specific environment variables.
- In Lifecycle, select Always start a new container so the tests will always start from a clean container.
- Just having
phpas the PHP executable should work. If everything is correct, PhpStorm should be showing you the PHP version, the path to thephp.inifile being used, and the version ofXDebugthat was mentioned in yourXDEBUG_VERSIONvariable. - Leave Debugger extension and Configuration options empty.
- Click on OK in the CLI Interpreters window.
You can now select the interpreter you just created, and click on OK. This run configuration will run the PHPUnit tests in your project from inside Docker, and allow for step-by-step debugging as needed.
XDebug for webpages in the PHPStorm IDE
If you want to be able to load any webpage and place breakpoints on the PHP code that serves it, follow these steps.
First, go to File - Settings - Servers and add a server:
- The name does not matter: call it Docker Container, for instance.
- Set the Host and Port just as you would use them to browse through the webapp in your host machine, and leave XDebug as the debugger.
- Tick the Use path mappings, and make sure that you enter a mapping from the main project folder to the path where it is located inside the Docker machine.
- Click on OK.
Now go to Run - Edit Configurations..., and add a new PHP Remote Debug configuration. You do not need to customise anything - simply press OK.
You should be able to now run this configuration, and PhpStorm will tell you that it has started listening for incoming PHP debug connections. Simply reload your webpage, and if you hit any breakpoints you should see PhpStorm highlight the relevant line and allow you to do step-by-step debugging.
Once you are done, select Run - Stop Listening for PHP Debug Connections. Webpages should not trigger your breakpoints anymore.